While going through redundancy checks in Internet Protocol this week, we were shown this homework problem by our professor [1]:
Using plotting software (Matlab, Maple, Excel…) give the graph for the number of redundant bits r required for m + r (data and redundant) message bits. The x-axis must measure the m + r bits and range from 1 to 5000 bits. What does the shape of the graph represent?
What does this mean?
Courtesy of Dr. Fulp’s lecture slides [2]: to find the number of redundancy bits r required for each message m, we must find a relationship between message length (in bits) m and the number of redundancy bits r.
m + r bits => r must indicate at least m + r + 1 different states
- Each state identifies a specific bit
- One of the states must indicate no error
Thus, if m + r + 1 states are needed and r can identify 2^r states, then:
2^r >= m + r + 1
Moving On!
Now that the equation to find the number of redundancy bits have been established, I needed a way to find all of the r values for when m + r <= 5000. No way I could’ve done this in hand! That’s when I decided to write a simple C++ program to calculate r for me.
#include <iostream>
#include <cmath>
#include <complex>
#include <fstream>

using namespace std;
ofstream outfile("out.txt");

int main() {
   int r;
      for (int m = 1; m <= 5000; m++) {
         cout << "For m: " << m << endl;
         outfile << m << ", ";
         r = 1000; //Arbitrary large starting value to find min
         for (r = 0; r <= 5000; r++) {
            if (pow(2, r) >= m + r + 1) {
               cout << "Min r: " << r << endl;
               outfile << r <<"\n";
               break;
            }
         }
      if (m + r == 5000)
      break;
   }
}
In line 16, you can see that the formula above was applied to find the minimum value of r for each m bit size. In the end, I also made sure to get only the values for when m + r are between 1 and 5000, which is what we need.
To make graphing easier, I outputted the results to a .txt file, with m and r delimited by a comma in between. This way, it will be easy to import and graph the data directly in Excel.
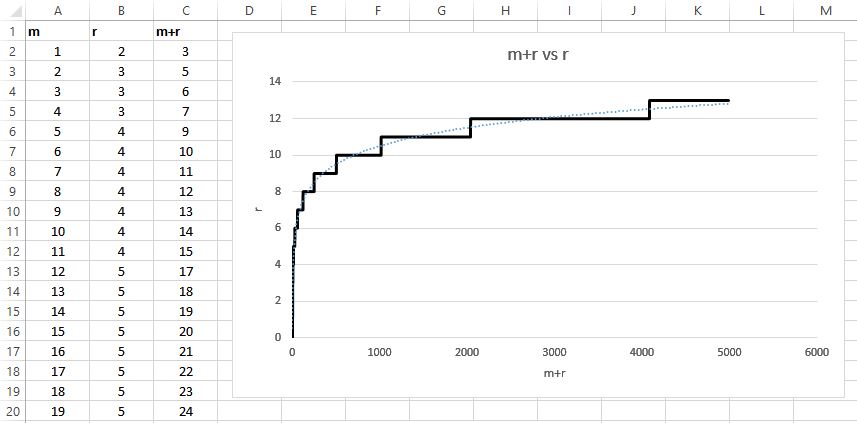
A logarithmic representation:
Graphs never lie.
As you can see above, m + r vs r ultimately follows a logarithmic trendline, where the bigger the message m, the less the number of redundancy bits r required. Pretty neat!
__________________________________________________________
[1]: Dr. Errin W. Fulp, Wake Forest University
[2]: Fulp, Errin W. Data Link Layer, Part 1. N.p.: n.p., 2 Sept. 2015. PDF.